Telescope Control
Goals
The objective of the telescope control software is to eventually track the satellite with the precision required for data transmission (insert angle here). According to the PAT sequence, this requires first coarse tracking, which has the purpose of tracking accurately enough so that the satellite can detect the uplink beacon, allowing it to more accurately track the OGS, which then allows the OGs to track the satellite more accurately (fine tracking) by detecting the downlink beacon from the satellite on the tracking camera, and using the FSM and its own guidance to track the satellite with enough accuracy for data transmission to be feasible (insert required angle). If possible, we want to be able to do all of this with no on-site human intervention (ie no one a the OGS pressing buttons and being exposed to powerful lasers).
For this to be possible, we need to:
-
Be able to calibrate and control the telescope to the accuracy required for data transmission and be able to move it in whatever path we desire
-
Be able to take inputs from the tracking camera to correct our pointing
-
Be able to take inputs on the GPS coordinates and TLE (two line element set, look it up! \) of the satellite to adjust the pointing of the OGS
First Things First
If we’re going to be tracking something, we need to have am idea of where it even is! For that, we use TLEs and astropy’s coordinate functions. We do this by using the TLE’s to generate 34 coordiantes for the satellite and its orbit (3 for space, 1 for time) in a coordinate frame where the earth is the ecenter, and then use the location of the OGS (Chicago in this case) to turn these coordinates into ALT-AZM coordinates from the point of view of the OGS with astropy’s SkyCoord object. This gives us the ALT and AZM coordinates of the satellite over time from the point of view of the satellite, which we can plot out in two graphs:
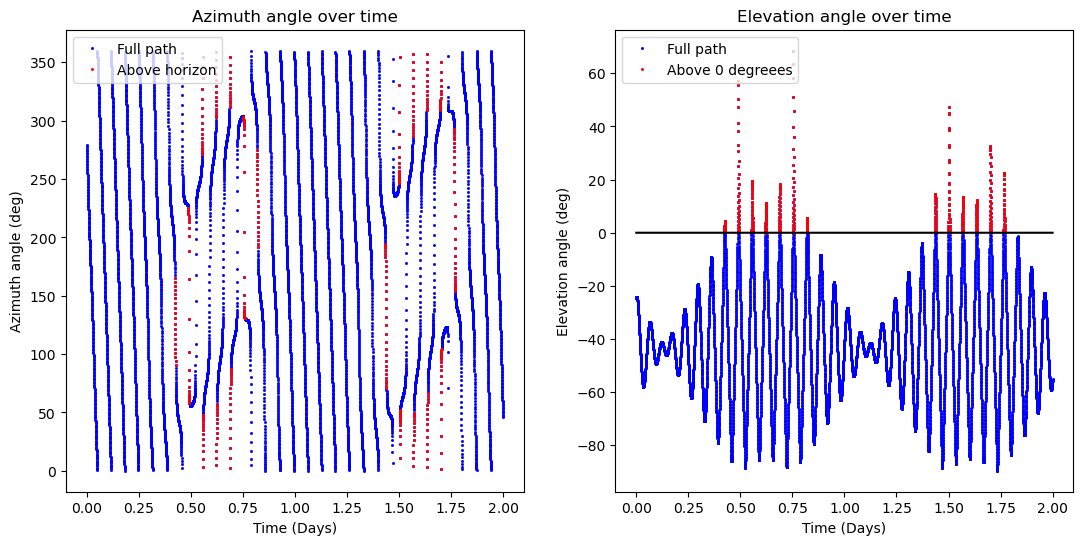
This is a plot showing the altitude and azimuth of the satellite as viewed from where we are simulating the OGS to be (Chicago in this case), as you would expect, the sattelite spends most of its time beneath the horizon (blue sections) and only occasionally pops up above the horizon (red sections). In our case, what we want to focus on are these red sections, as they represent potentially viable satellite passes (aka orbits where the satellite is visible from the OGS). In fact, if we were to simulate this over a longer period of time and look at how the elevation peaks of these passes are distributed, we would get a histogram that looks like this:
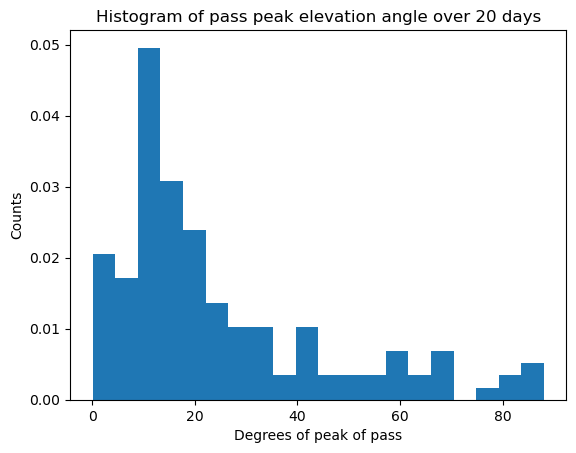
As you can see, for ISS orbit, most of our passes are actually quite low