Link Budget Overview
A link budget involves an exhaustive list of loss calculations which, when added or multiplied together, should give an accurate estimate of the power received at one end of a link, given a certain power dispatched at the other end of the link. A link budget begins with a certain laser output power, in dBm. Then, all relevant losses and gains, in dB, are added to that output power dBm value. The final result is a received power estimate, in dBm, which can then be converted to watts.
PULSE-A Link Budgeting
The PULSE-A project encompasses three link budgets. There is a downlink transmission, a downlink beacon, and an uplink beacon. For these budgets to successfully “close,” a calculation of all of the losses and gains must result in a received power that is sufficient for transmission. Some losses and gains are obtained via the spec sheet of the equipment used, while others are calculated. The value of each individual quantity is generally different between each of the three link budgets, so only the methods are specified below.
Type of Loss
| Type of Loss | Calculated | Notes |
|---|---|---|
Laser output power |
Spec sheet |
Power of the laser itself |
EOM insertion loss |
Spec sheet |
Loss caused by modulator; only considered in downlink transmission |
EDFA gain |
Spec sheet |
Signal amplification by the EDFA |
Fiber connection loss |
Spec sheet |
Loss caused by interface of different optical fibers |
Optical antenna gain |
32/θ², where θ is the beam divergence angle (Lambert, 1995) |
Related to how well the beam is “focused” toward the receiver |
Space loss |
(λ/4πL)² , where λ is the wavelength of the beam and L is the mean distance between the OGS and CubeSat (Lambert, 1995) |
Related to how the beam spreads out as it propagates through space |
Telescope gain |
(πD/λ)² , where D is the diameter of the receiver (Lambert, 1995) |
Related to the receiver’s ability to collect the beam with its aperture |
Atmospheric attenuation loss |
Simulated with MODTRAN |
|
Optical system loss |
Simulated with Zemax |
Non-ideal internal losses of the system; only considered in downlink transmission |
Scintillation loss |
Rough estimate |
Small for downlink, large (and so far unknown to us) for uplink beacon |
Telescope optical loss |
Rough estimate |
Non-ideal internal losses within telescope receiver |
Fiber coupling loss |
Rough estimate |
Misalignment between optical fiber and beam |
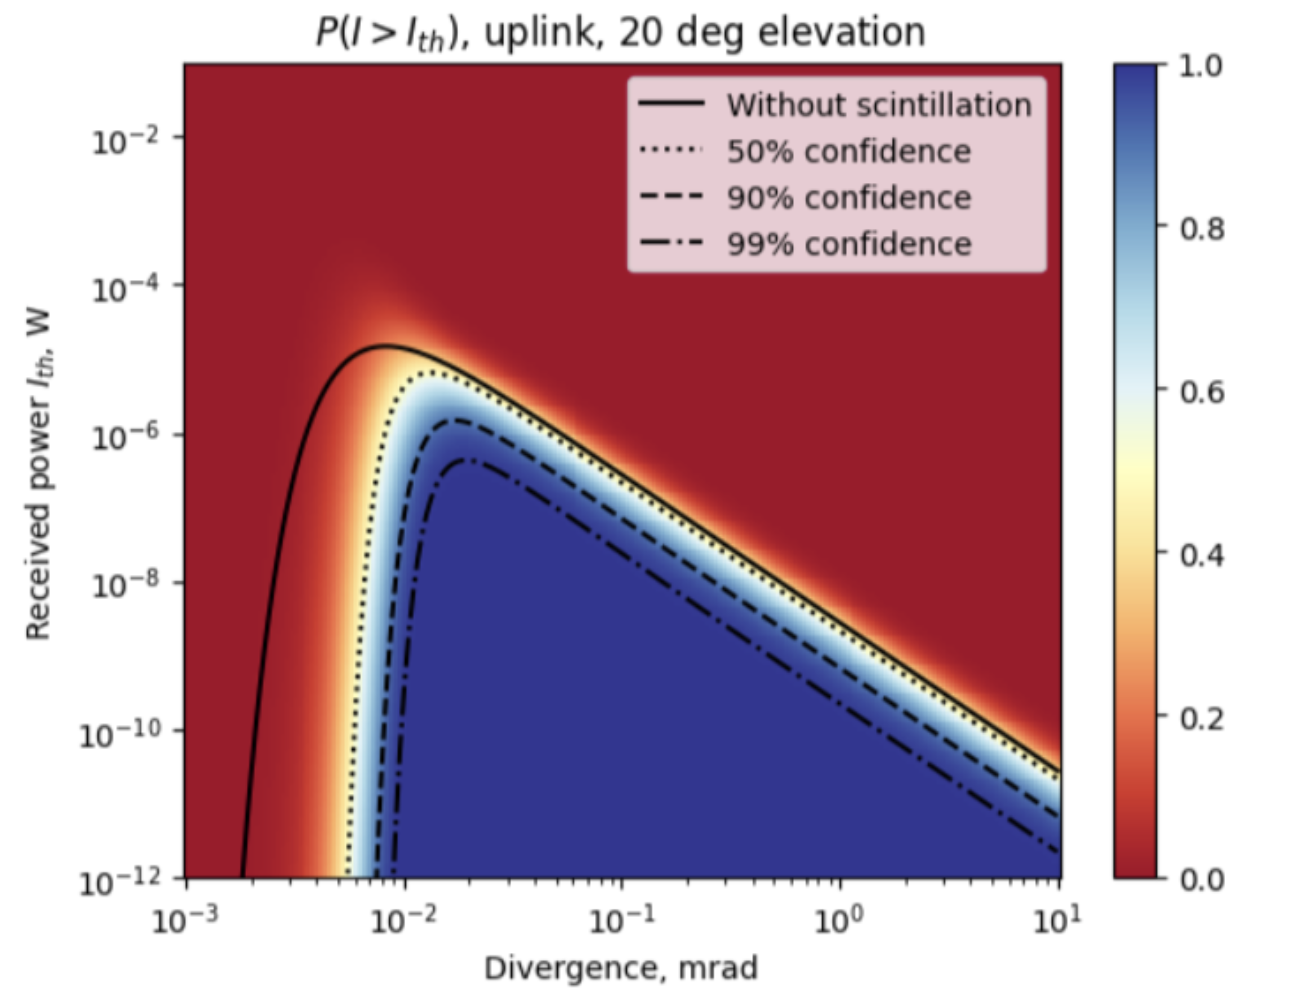
The uplink beacon link budget is still a work in progress. For that budget to close with any certainty, accurate estimates of loss due to scintillation must be accounted for, and a choice of modulation must be made.
Power Received at OGS
The power received from the downlink transmission beam must reach a crucial threshold for mission success. The link budget calculations, with full losses and gains, estimate that 2 nanowatts of power would be received at OGS from the downlink transmission beam. MIT STARLab Optical Link Budget software, with the same parameters, estimates a received power at the ground station of 3 nanowatts. Given the proximity of these two estimates, we are satisfied that the link budget calculations are accurate. Both estimates surpass the theoretical received power threshold of approximately 0.3 nanowatts, which is our expected noise power. The SNR, then, is approximately 8.91.
Optimal Downlink Transmission Divergence Angle Calculation
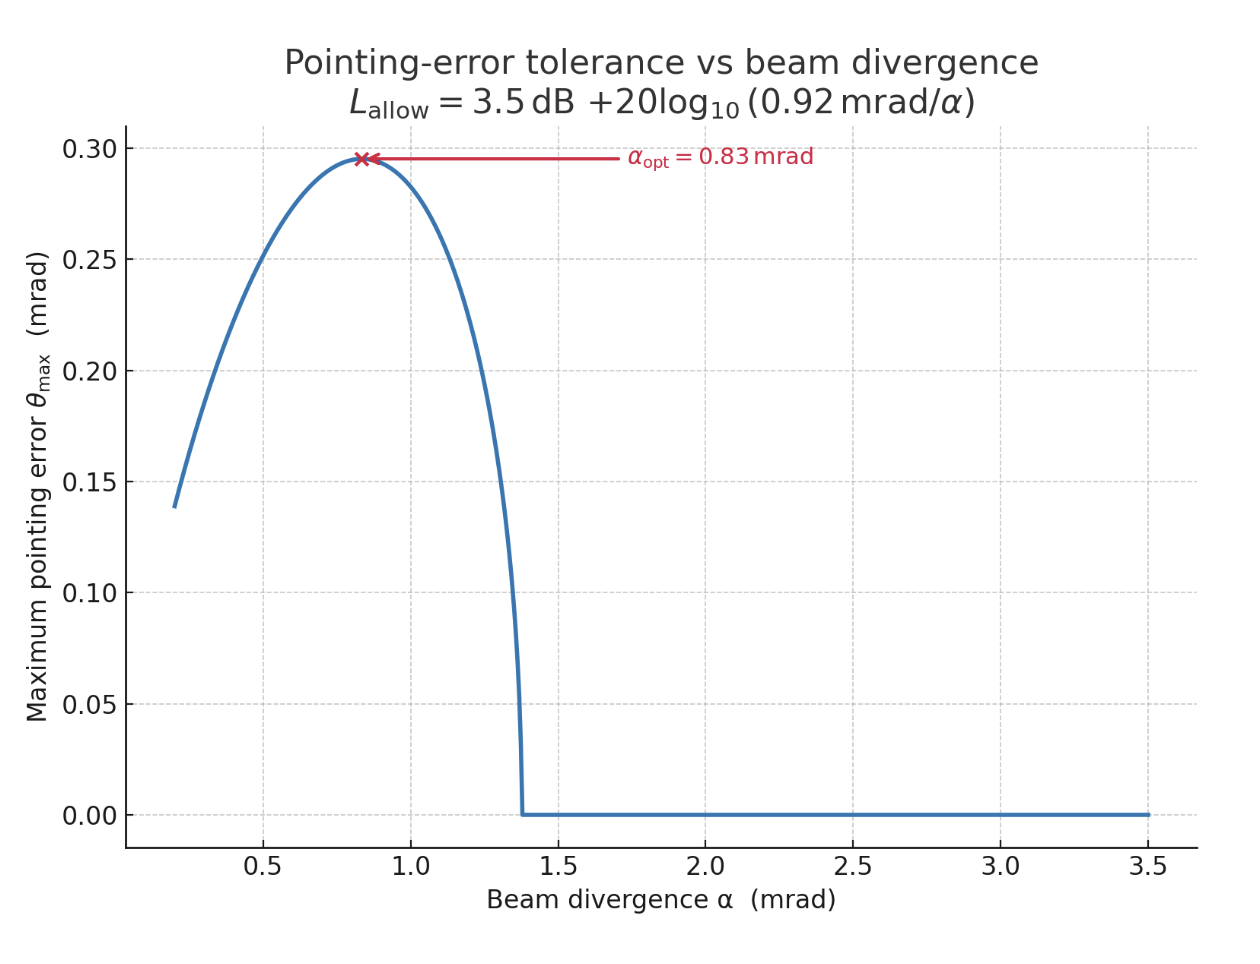
The divergence angle is utilized in both calculations of loss due to pointing error, and optical antenna gain. Generally, increasing the divergence angle is associated with decreased pointing error loss and decreased optical antenna gain. This conflict means that we can optimize the divergence angle to maximize gain and minimize loss, and consequently maximize the angle of pointing error allowed in our budget.
We first calculated the antenna gain with a hypothetical divergence angle of 0.92 milliradians, which was arbitrarily chosen based on the spec of a commercially available collimator, and then we set the total allowable loss “due to” divergence angle at 3.5 dB. This includes all loss due to pointing error, but also any loss to the antenna gain that was calculated with a 0.92 milliradian divergence angle.
We can then graph the maximum angle of error (that stays within 3.5 dB of total loss, as outlined) as a function of divergence angle. The divergence angle that gives the largest maximum angle of error is the optimized divergence angle: