Zemax OpticStudio
Purpose
-
Validate Optical Performance of Optical Ground Station (OGS) & Payload
-
Create Simulations representing optical layouts
-
Generate Tolerancing Data accounting for mechanical & thermal effects on optical misalignment
Overview
Ansys Zemax OpticStudio (Zemax) is an optical simulation software used as a preliminary validation analysis tool for the Optical Ground Station (OGS) & Payload. Zemax, combined with its Python ZOS-API for automated ray-tracing, more efficiently provides data on the geometric misalignments within the optical design, which also helps achieve a more precise understanding of how certain hypothesized physical phenomena are propagating through the optical system.
Some examples of acquired Zemax applications include: * Testing slight misalignments from lens vibrations * The thermal expansion of the CubeSat’s plating * Beam polarization conversion efficiency * Offset trajectories caused by the uplink beacon’s angular misalignment
This data is used to obtain thresholds for the PULSE-A laser-communications optical performance, which not only determines which products are most effective, but also how the sub-assembly designs should be refined to satisfy these thresholds.
Relevant Zemax Tools
-
Zemax can model the components relevant to the Optical Payload: sources (beams), lenses, mirrors, filters
-
Jones Matrices: used for analyzing polarization propagation through system (further research needed)
-
Sequential-Mode Analysis: Linear beam paths, but more comprehensive beam-profile analysis, polarization data, etc.
-
Considering deeper analysis of individual components along beam paths, e.g. Polarization through waveplates, more gaussian beam-profile data at QPD
-
-
Nonsequential-Mode Analysis: Optimal for complex beam paths → beam-splitting, multiple sources, scattering, stray light, etc.
-
CubeSat’s Optical Payload Design is best-tailored to Nonsequential modeling: 2 sources to analyze (OGS Uplink Beacon + Payload Downlink Transmission)
-
-
Coating Data Files: Method for defining customized transmittance/reflectance for nonsequential ray analysis
-
Useful for simulating products accurate to the product specifications: wavepass dichroics & bandpass filters
-
-
Ray-tracing: Zemax’s method for analyzing detector data (e.g. QPD)
-
Nonsequential-Mode: exclusively Irradiance Maps
-
-
ZOS-API + Python: Interacting with Zemax’s User Interface without the GUI → Better Automation
-
Powerful Tool for Tolerancing Data across various parameter values (e.g. tilt angles, component positions, component sizes, etc.)
-
-
Well-documented Public Resources:
-
Zemax Knowledge Base: Main hub for Zemax Tutorials
-
Zemax Community Forum: Site to ask questions about specific Zemax issues
-
Zemax also provides many test examples that apply useful features (e.g. ZOS-API Connection examples, approaches to model gaussian sources)
-
Zemax Simulation Procedure
-
Identify theoretical concerns with the optical system (e.g. vibration, thermal, body-pointing, etc.)
-
Research Zemax’s available tools for analyzing the problem (e.g. ray-tracing, coating, irradiance maps, sequential vs. non-sequential modes, ZOS-API, etc.)
-
Identify available data types that Zemax can output (e.g. power, centroid, irradiance, etc.)
-
Determine characterization of optical performance (Data on QPD/Detectors)
-
Develop algorithm for ray-tracing & tweaking parameters (ZOS-API Python)
-
Collect relevant data & analyze tolerancing results
Simulation Results
-
Accurate, Non-trivial Model of Payload Optical Layout
-
Capable of Non-sequential 3D Layout
Current Payload Optical Layout * Blue beams represent part of the OGS Uplink Beacon (1064nm); Green beams represent part of the Payload Downlink Transmission (1550nm).
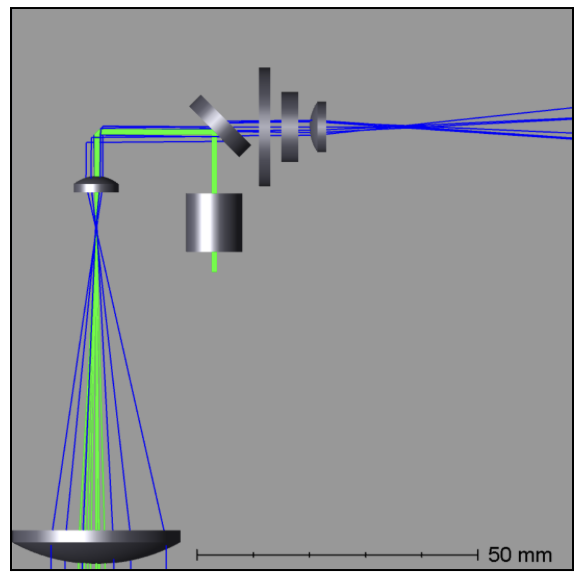
The Transmission assembly encodes and modulates (at 1–10 MHz) the data into a circularly-polarized, amplified beam for the OGS to receive and decode. The transmission beam follows the same optical path as the uplink beacon, and requires a dichroic beam-splitter to multiplex the two signals.
Use of Irradiance Maps
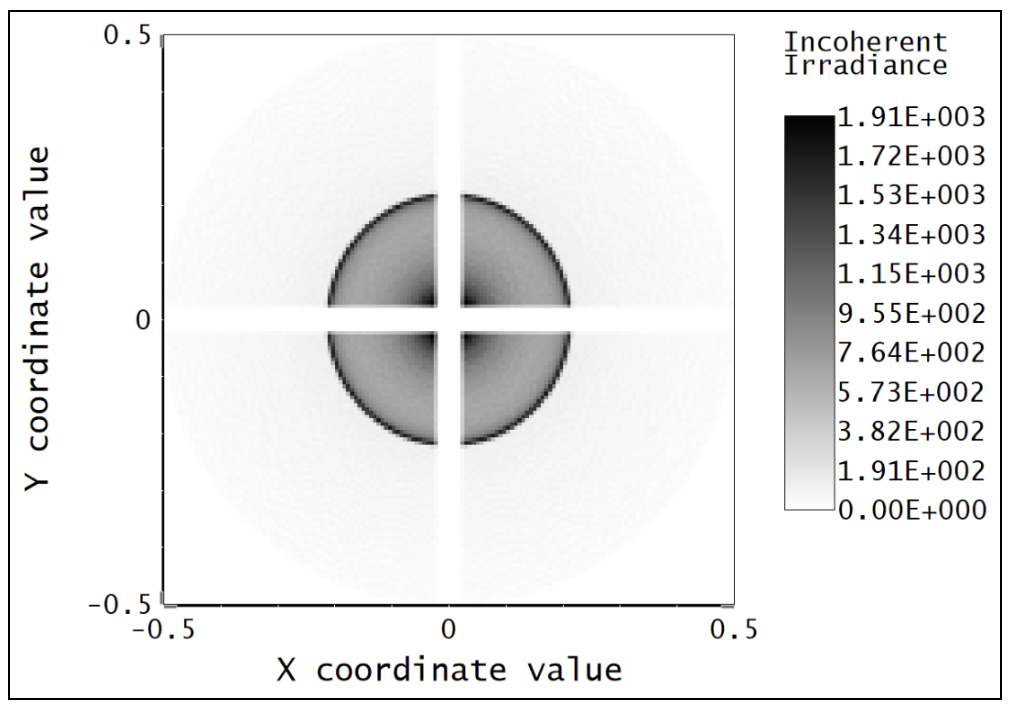
Irradiance Map of OGS-Beacon Power Distribution on QPD Detector
Near-Center Gaussian QPD Irradiance Profile Plot_
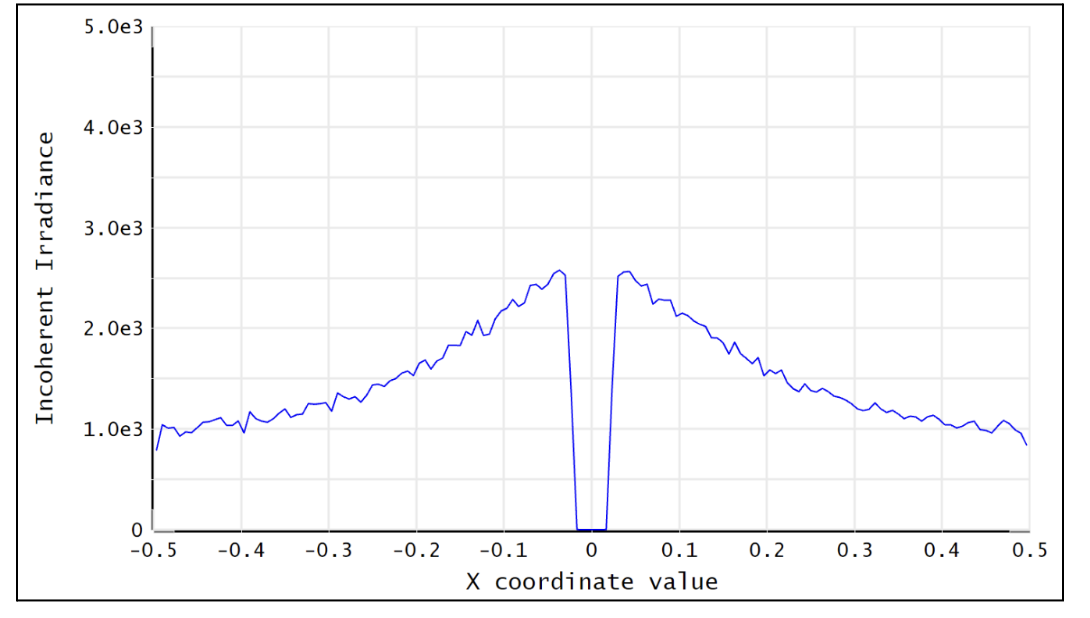
Note: the gaps between the gaussian distribution represent dead-zones of the QPD (between each quadrant). Darker (more irradiant) circumference & halo hypothesized to be caused by lens spherical aberrations.
The Payload uses a 2x2 Quadrant Photodiode (QPD) with 1mm active diameter. The size constraints of such a detector require extremely precise pointing & focusing from other Payload assemblies. Slight misalignments throughout the system result in non-uniform voltage signals.
ZOS-API in Python
Automates interaction with Zemax OpticStudio’s user interface (replaces GUI) via Namespaces (OOP). Iterative ray-tracing opens up tolerancing over multiple parameter values for a single/multiple optical components.
FSM Mirror Preliminary Requirements Determination
The FSM corrects uplink beacon misalignments caused by body-pointing, thermal drift, or vibrations. For angular errors up to 1.00°, the FSM adjusts the optical path to center the beam on the quadrant photodiode (QPD).
Predicted FSM Mirror Requirements from Zemax Simulations
| Specification | Requirement | Justification |
|---|---|---|
Mechanical Angle (deg.) |
≥ ~4.1° |
Capacity for overcorrecting from 1.00° Body-Pointing Error ensures that the optimal FSM Tilt angle is within the maximum mechanical FSM Tilt range. |
Active Diameter (mm) |
≥ 5.00mm |
Help to prevent vignetting along the edges of the FSM Mirror to collect the entire uplink beacon. |
Payload Body-Pointing Angular Misalignment Threshold for Fixed FSM Max Tilt Angle
| Specifications: | Requirement: | Justification: |
|---|---|---|
Mechanical Angle (deg.) |
≥ ~4.1° |
Capacity for overcorrecting from 1.00° Body-Pointing Error ensures that the optimal FSM Tilt angle is within the maximum mechanical FSM Tilt range. |
Active Diameter (mm) |
≥ 5.00mm |
Help to prevent vignetting along the edges of the FSM Mirror to collect the entire uplink beacon. |
Preliminary Validation of Thermal Model: Plate Expansion
Assuming Uniform Expansion of CubeSat Aluminum Plating. We expect there to be misalignments due to thermal expansion of the plates.
Plots of Received Centroid & Power on QPD Over a Proportional Expansion Factor of Plating (from Zemax)
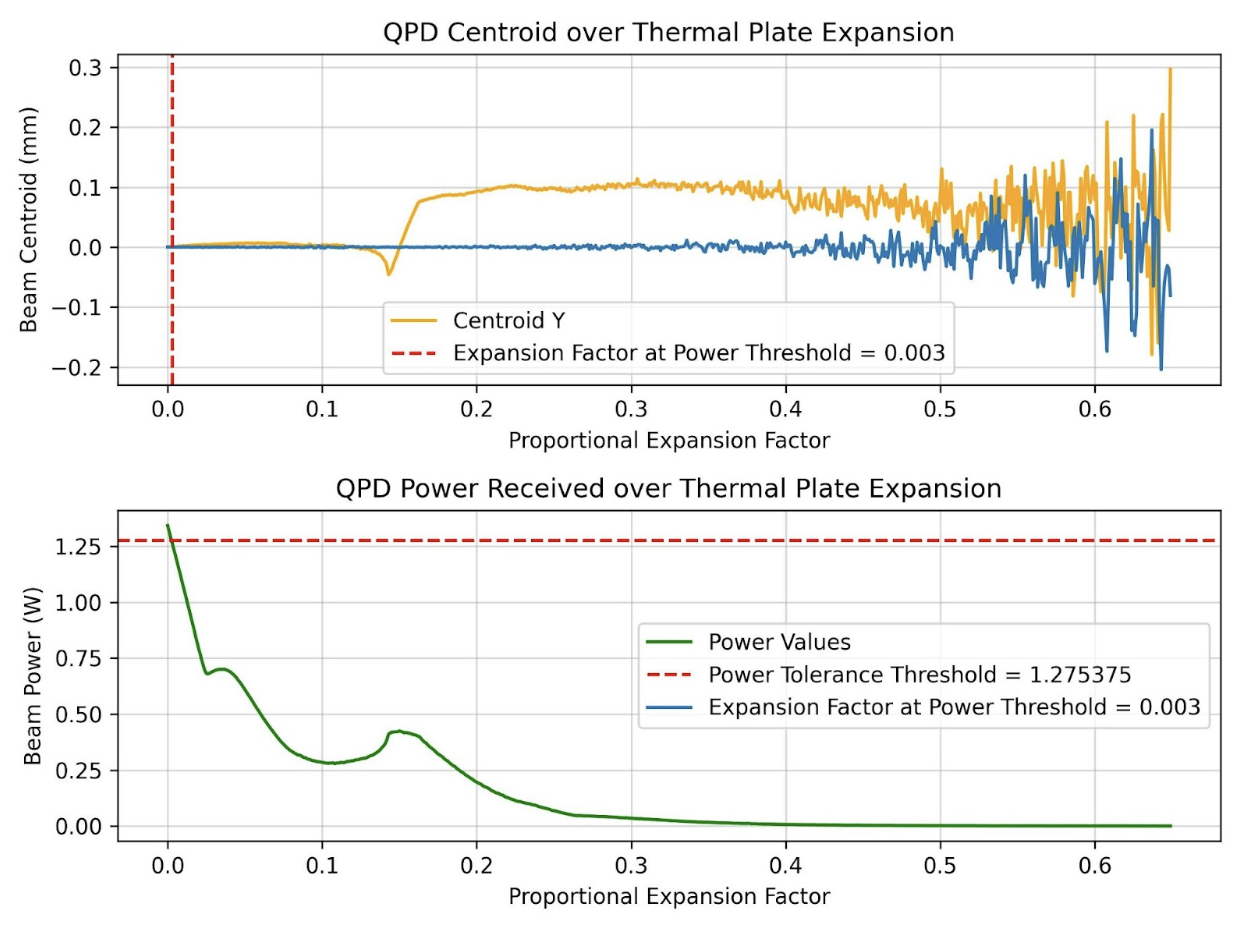
Note: Inconsistent Centroid Behavior observed starting from expansion factor of 0.4. Power threshold is a more sensitive characterization than the centroid.
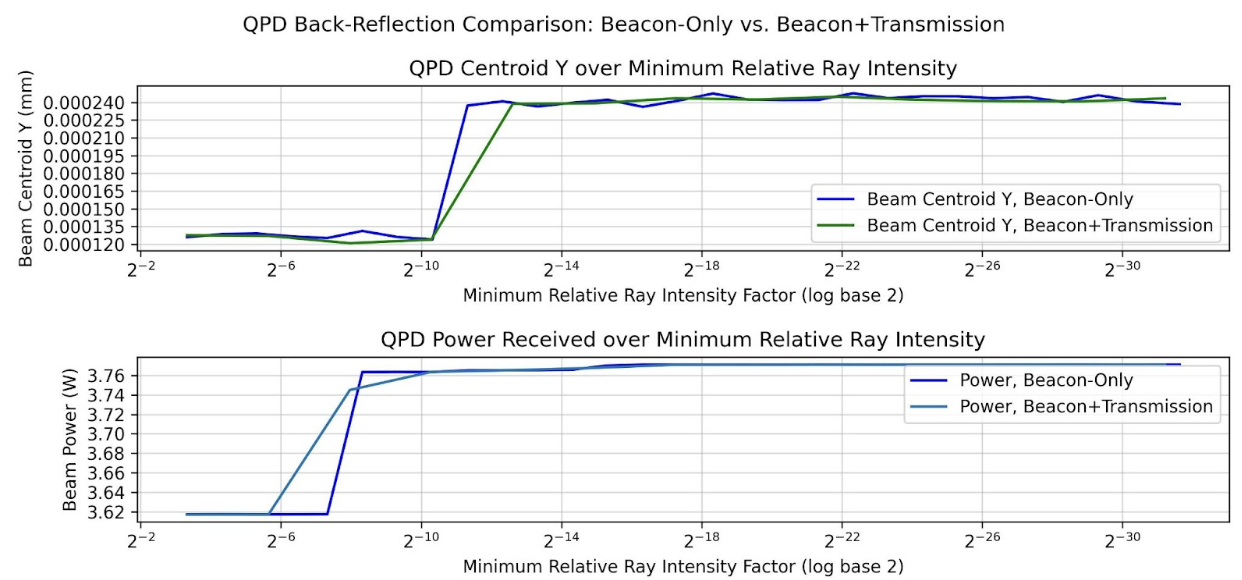
Preliminary Validation of Back-Reflected Light
Optical components have imperfect transmission from ideal trajectory, and can reflect light backward through the optical layout.
Plots of Received Centroid & Total Power on QPD Over Minimum Relative Ray Intensity (MRRI)
-
Minimum Relative Ray Intensity: Input as a scaling factor with respect to the incoming intensity of a bundle through an optical component, “Minimum Relative Ray Intensity” is defined as the minimum intensity of a back-reflected bundle that will be considered in the Zemax ray-trace analysis (e.g.: 2-6 x incoming intensity)
-
Consider rays both from OGS beacon & Payload transmission: Not easily distinguishable from OGS-beacon-only data. Centroid remains as an unconcerning factor; spike around 2-10 still is 3 orders of magnitude below the order of the QPD radius (0.5mm)
-
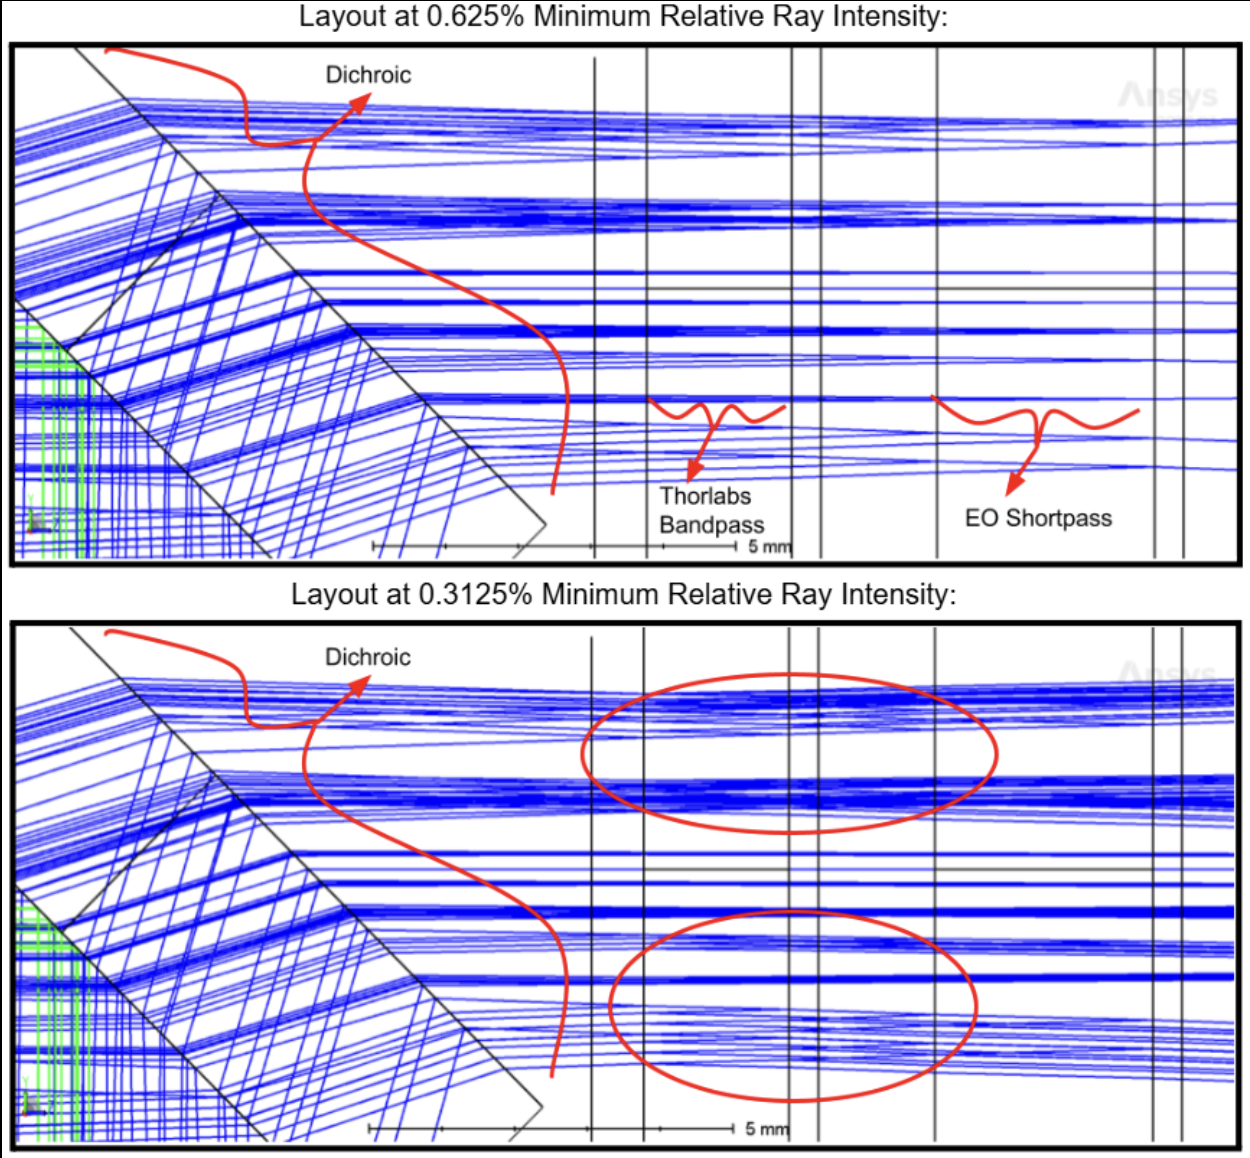
Power: 4.04% power spike around MRRI factor of 0.003125. We hypothesized to originate from Detection Subassembly’s filter stack:
Power Values through Optical Components (Uplink Beacon)
| Max Body-Pointing Tolerance (°, deg.): | FSM Max Tilt Angle (°, deg.): | Final Centroid pos. (+ overcorrection) (mm): |
|---|---|---|
0% |
1.109 |
0.0 + 0.00069201 |
5% |
1.056 |
0.0 + 0.00071147 |
Sample Rays Propagating through DS Filter Stack under different MRRI values (%)_
Understanding power losses through optical system: * Concerning the Payload link budget, how much power is being received at the QPD, and what causes the power losses? * Power Losses are more relevant to calculate as percentages (applicable to any product)
Power Values through Optical Components (Transmission)
| Component Name | Beacon Loss from Total (%) | Beacon Loss from Previous Component (%) |
|---|---|---|
Kepl. Telescope Aperture (Initial) |
0.0 |
0.0 |
Kepl. Telescope 30mm Lens (EO #45-241) |
0.49498 |
0.49498 |
Kepl. Telescope 9mm Lens (EO #28-952) |
0.90462 |
0.41168 |
FSM Mirror (Mirrorcle 6.4mm) |
2.2843 |
1.3923 |
SWP Dichroic (Thorlabs DMSP 1180T) |
8.665 |
6.5298 |
Bandpass Filter (Thorlabs FLH1064-8) |
23.756 |
16.523 |
Shortpass Filter (EO #89-671) |
36.862 |
17.189 |
QPD Focus Lens (EO #49-876) |
61.807 |
39.509 |
Impact
-
Develop Preliminary Prototype for entire Payload Optical Layout (that is not currently feasible for physical lab validation)
-
Helped determine some relevant Payload FSM requirements: Minimum Diameter & Maximum Actuator Tilt Angle
-
Determined requirement for ADCS satellite alignment
-
Preliminary Validation of Current Payload Design for thermal & back-reflection tolerances
Next Steps
-
Develop Model in Sequential Mode: more comprehensive ray-trace analysis (More Gaussian Beam Data, Polarization Data, etc.), at the cost of less complex optical paths
-
Perform Vibrational Testing
-
Observe Polarization Data through System
-
Test Mirror Slew-Rate/FSM-QPD Feedback Loop through ZOS-API Python
-
Obtain more data on body-pointing misalignment vs. Required FSM Tilt vs. QPD Power Distribution to develop an electronic voltage-transfer function